Clocking the Sun's spin: a DIY experiment
SCIENCE. Track sunspots and measure the Sun's rotation with your smart telescope.
WARNING! While we love stargazing, the Sun is one star you should never gaze directly at with unprotected eyes. Please only attempt this experiment through a suitable telescope equipped with solar filter.
It’s hard not to go all armchair-philosopher when pondering our home star. I mean, the Sun is a big part of the story of how we even exist in the first place. Its gravity coalesced the disk of dust from which the rest of the Solar System (and we) eventually formed. It also provides the energy to heat our atmosphere, grow our food, and just generally keep the world as we know it moving. And here we stand, one day billions of years down the line, wondering at it through our telescopes!
Smart telescopes do deliver remarkable views of the Sun, and this is a particularly great time to look. NASA and NOAA announced back in October that the Sun had reached ‘Solar Maximum’, the phase in its 11-year cycle when magnetic activity peaks and we see the most sunspots. This maximum should last well into 2025.
Sunspots are relatively colder/darker areas caused by a buildup of magnetic field lines, and the appearance of more and/or bigger sunspots can signal solar weather headed our way. They’re fun to look at, as they stand out clearly on the Sun’s otherwise blank face. But I also wondered if there’s maybe something we can actually do with sunspots, beyond just admiring them. It turns out there is! As we approach the winter solstice, I figured those of us in the north at least could use a little more Sun, so I decided to put together this science activity about it.
Experiment: judging the Sun by its spots
The Sun spins around its own axis just like our Earth. Unlike the Earth, however, the Sun isn’t a solid object but a giant ball of superheated gas, so it doesn’t have just one rotational speed but turns at different rates depending on latitude (the east-west lines, parallel to the equator, which tell you how far you are between equator and pole). Sunspots tend individually to travel across the Sun’s face with its surface, following roughly the same latitude (on occasion they can migrate, but for our present purposes let’s treat them as fixed in the north-south direction). Since they each generally stick to their own latitudinal lane, that means they reveal the Sun’s spin, at least for their particular north or south position.
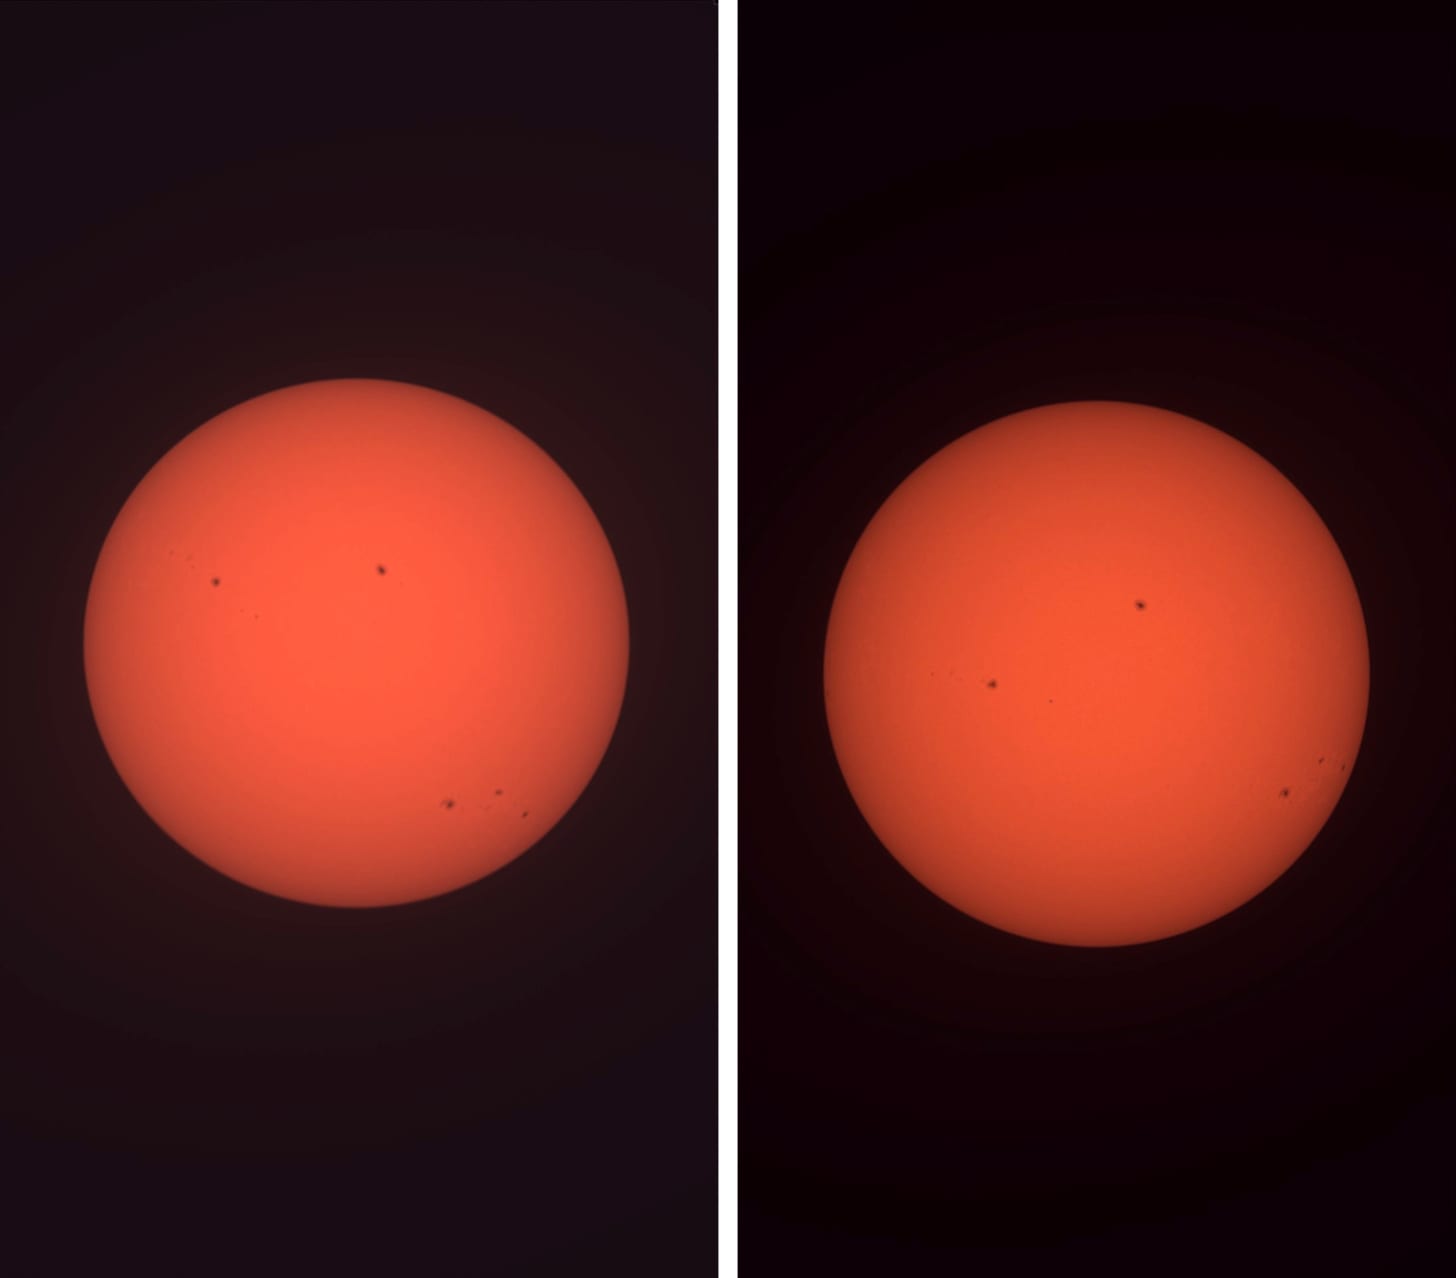
So here’s an experiment idea: let’s take at least two pictures of the Sun, around 24 hours apart, and by comparing how the spots move across these pictures, calculate the Sun’s rotational speed at the spots’ latitude. Easy peasy, right?
How I looked at it
Well, it turns out there are at least a couple of curdles in this otherwise buttermilk-smooth plan. First, in order to track the sunspots’ rotation we’ll need to identify which direction is up, or north, in each solar image. That apparent angle changes constantly, even for pictures taken from the same location, due to things like the Earth’s spin, time of year/position in our orbit around the Sun, and camera rotation.
But there’s a solution! By comparing our two images and assuming spots stay on roughly the same latitude as they move, we can rotate the images so they align on the same north-south axis, with our spots then traveling in a line from west to east (left to right). Note that sunspots develop, so they may change looks somewhat between your two shots – though they’re hopefully still recognizable from group to group. In some cases one or more of your spots may disappear entirely between the two sessions. That’s natural. Generally around 24 hours is a good gap for your images – long enough to allow for measurable movement, but short enough so most spots in your original picture will not have had time to evolve too much or disappear around the Sun’s backside.
With our two images aligned, it’s as easy as overlaying a latitude/longitude grid (longitude lines are the north-south ones running from pole to pole), measuring a particular spot’s progress during the intervening period, and using the known circumference of the Sun to calculate its rotational speed.
Here’s how I tackled it, with nothing more than my smart telescope and phone (if you’re familiar with desktop photo-editing tools like Photoshop or the awesome and free Gimp, those can be an even better alternative to the process laid out below, enabling easier, more exact measurement; but for this current post I wanted to find a way for anyone to be able to do this without specialized tools or knowledge):

Starting with two Sun images (above), we need a tool to overlay them with transparency and rotate them as required. The easiest way I found to do that with my iPhone is via the Pages app. This app comes pre-installed on most iPhones, but if you don’t already have it it’s available for free from the App Store. For Android users: I don’t own one so haven’t been able to check myself, but apparently there are no built-in tools enabling a similar process to what I’ll be doing here with my iPhone. But, it does look like the free app Snapseed allows the same key steps – specifically its Double Exposure feature.
Open Pages from your iPhone home screen and tap the Start Writing button to create a blank document.
With the new document open, tap the + symbol at the top of the screen, then Photo or Video, and select your first Sun image from your Photos library (we’ll call this image A).
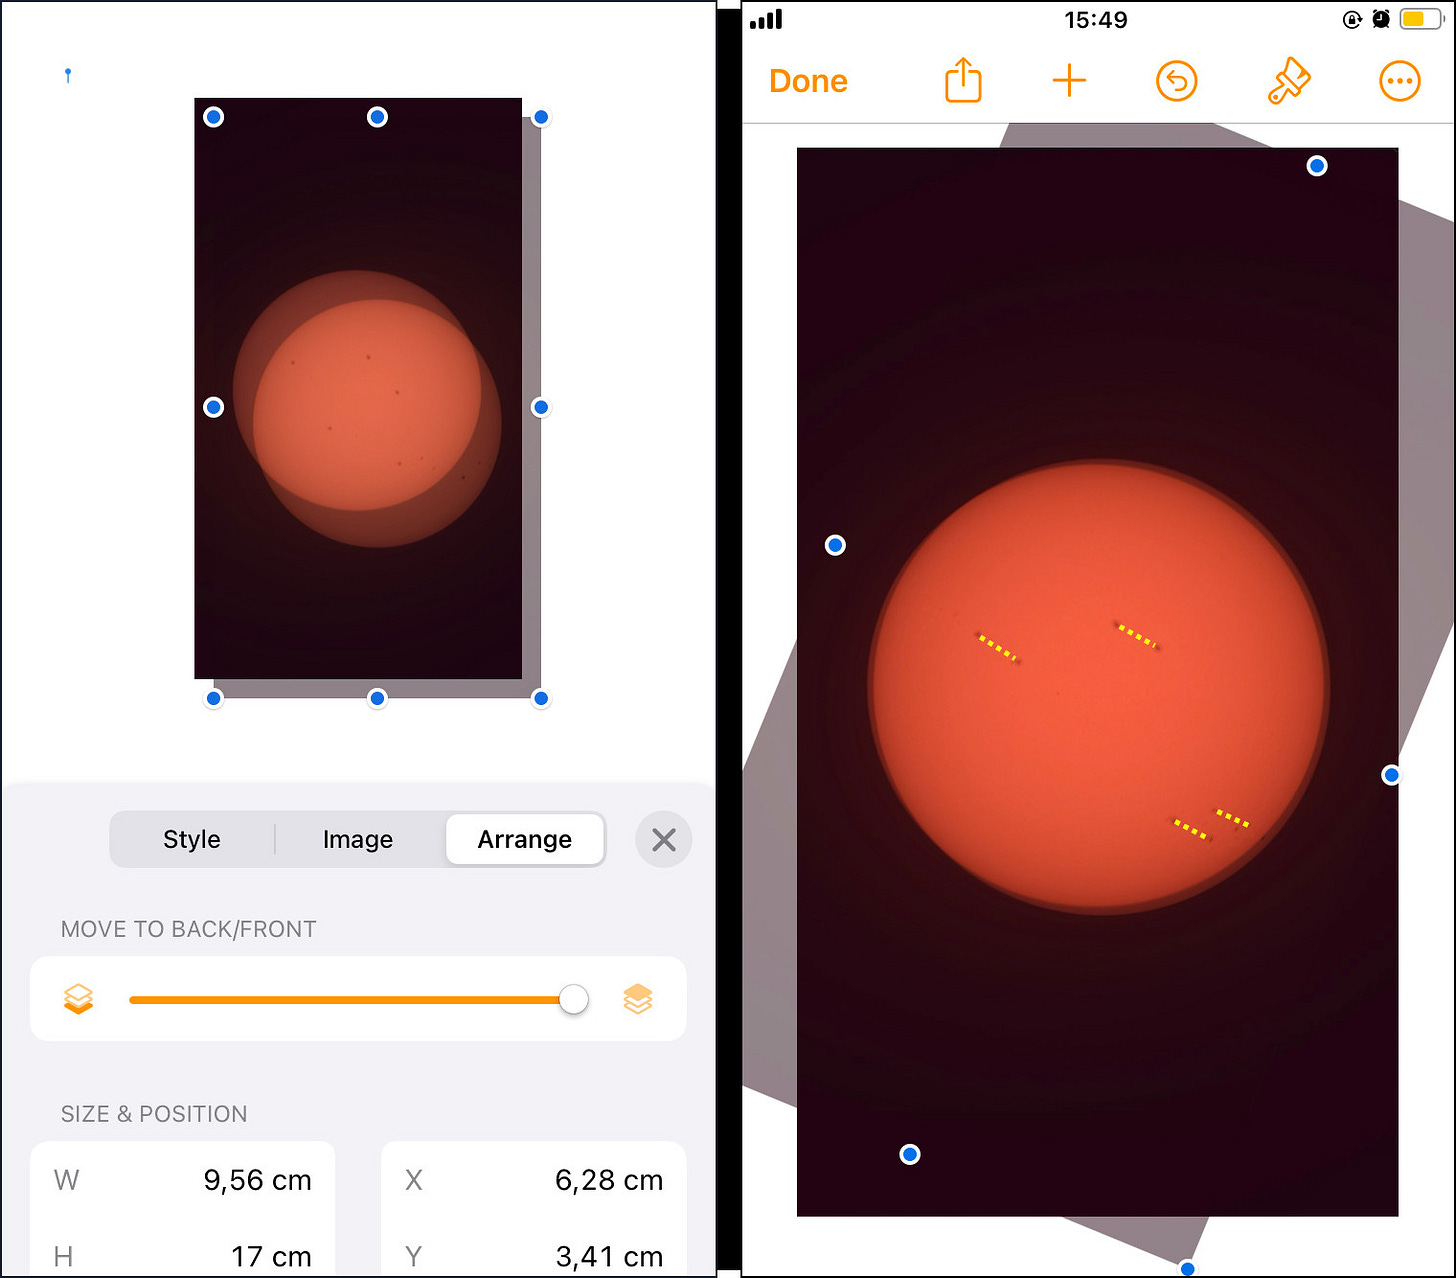
Repeat this step for your later photo (image B). Your screen should now look like the left page above.
With image B selected (thin blue highlight line surrounding it), tap the paintbrush icon along the screen’s top edge, select Style and scroll down until you reach the Opacity slider. Set opacity to 50%.

Tap the Arrange tab, then scroll down and tap the More Options button to turn on layers. The MOVE TO BACK/FRONT slider should indicate image B is on the top (front) layer. Image B should now be 50% opaque and overlaying image A (left screen above). Tap the X button to close the Arrange panel.
Next, align the two photos so image B is overlaying image A as closely as you can manage. To do this hold down on image B with a single finger, drag it around until you have it where you want it, then release. You should now see one disk with all spots from both photos showing through.
With the two photos superimposed, rotate image B until the spots form a series of imaginary parallel-ish line segments of similar length, with the “before” spot from image A as the starting point of each segment, and the “after” spot from image B as its end (I added yellow dotted lines to the right-hand screen above to help show what I mean; you won’t see yellow lines on your images, I just sketched them in here to help clarify ;) To rotate, press and hold on image B with two fingers, then twirl your fingers in a rotating gesture. Voilà! You’ve now discovered the apparent angle of the Sun’s axis in these two photos: it’s perpendicular to your imaginary line segments, leaning something like 30 degrees to the right! Note: this approach will only work if you have at least two separate sunspots that carry over between both images. If you don’t have two spots to work with, you’ll have to try again later with a new image pair.
I’m not going to lie, moving and rotating layers in Pages can get fiddly. There’s a lot going on and little space/few gestures to work with. You might have to try an extra time or two to get it right. But hey, it wouldn’t be an adventure without challenges, right? And we’re almost to the best part!

Now we need to add the latitude/longitude grid lines that help us measure how far our spots have travelled. Let’s use this grid from the Stanford Solar Center. Note that the grid divides the globe into 15-degree chunks for both latitude and longitude. Download the image to your Photos library.
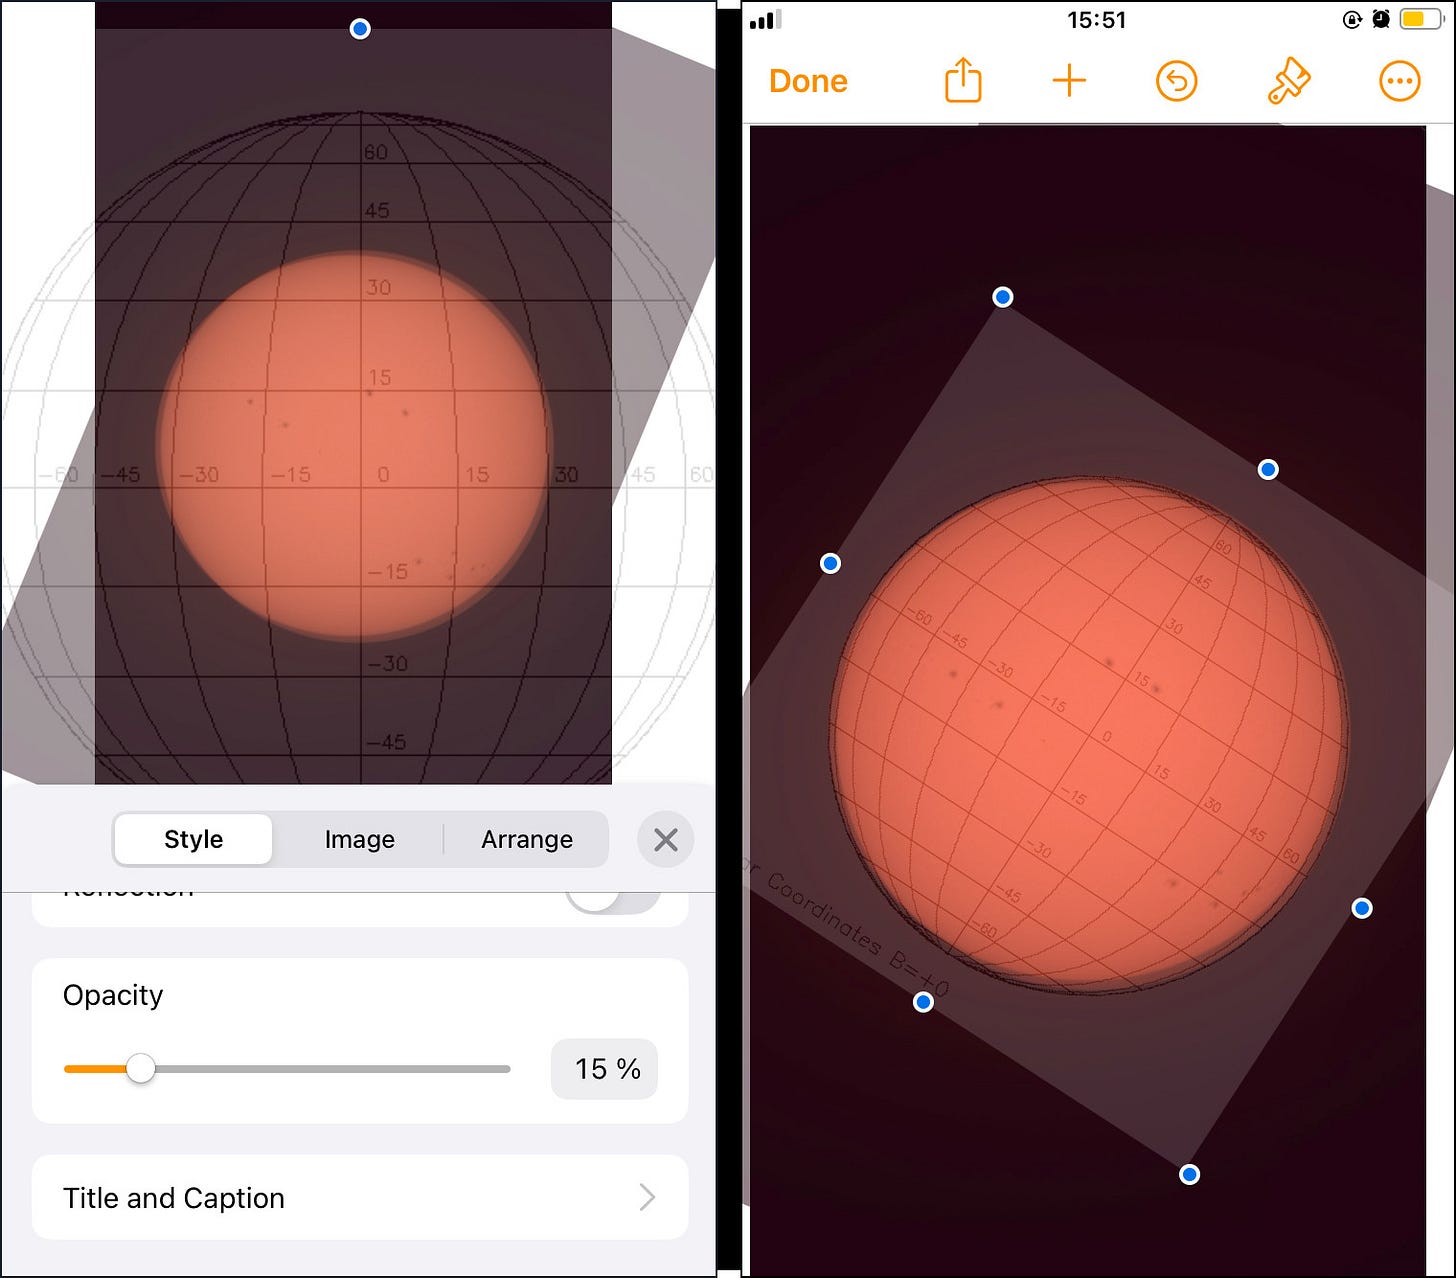
Tap the + symbol to add the grid to your Pages document. Tap the paintbrush icon, and then the Style tab. Scroll down to set the grid’s opacity to 15% (left screen above). Tap the X button to close the Style panel.
The last step in Pages is to scale the grid so it matches the size of your disk, then rotate it to align with your axis. The grid’s latitude lines should be roughly parallel to your imaginary line segments. Hold and drag the grid image’s blue anchor dots to scale. Twirl with two fingers to rotate.
Once you have the three images (image A, image B, and grid) lined up to your satisfaction (right screen above), grab a screenshot . And we’re now free to forget about Pages again – at least until we want to make another on-the-fly measurement like this one! Whew!
Ok, so we have what we need to gather our data and do our calculation, now what do we do with it?
In my case I decided to use the spot zooming along close to the 15-degree latitude line, and I estimated that it had travelled about 12 degrees of longitude between when I snapped my two images. Try to pick a spot which is relatively close to the center at both start- and end-points, to avoid the foreshortening that naturally happens closer to the edge due to the spherical shape.
I took image A at 16:22:56 on Day 1 and image B at 13:35:20 on Day 2. To find the time difference, I need to convert both times to decimal, which works out to 16.38 hours (1376 seconds into the hour, divided by a total of 3600 seconds per hour = .38) and 13.59 hours. Day 2 is also 24 hours later, so we need to factor that in. The result is 37.59 - 16.38 = 21.21 hours time difference between image B and image A.
Ok, we know this spot moved 12 degrees around the Sun’s axis in 21.21 hours … but how many kilometers did it actually travel? To find that, we need to calculate the circumference of the (… guesstimating …) 16 degree latitude line. The formula is:
Circumference in km at a given latitude = 2 * π * (cos(X) * 695,700 km)
Where X is the latitude in degrees, and 695,700 km is the radius of the Sun at its equator (that’s right, time to break out our phone’s scientific calculator, we’re sciencing here! Btw, did you know the Sun is amazingly spherical, with a difference of only 10 km in its diameter as measured at the equator and between its poles? Much more spherical than the Earth. Incredible!) For me, this works out to 4,201,879 km. That’s about how far my spot would potentially have to travel to round the Sun at its latitude of 16 degrees.
And now, finally: the moment we get to bring it all together – woohoo! Drumroll please! Because our last key formula is a simple one:
      Speed in km / hr = distance in km / time in hrs

In this case, that means …

      Speed in km / hr = (12 / 360) * 4,201,879 km / 21.21 hours
… where (12 / 360) gives the percent of the way around the Sun my spot has actually traveled (360 degrees being a full circle). This works out to a final speed estimate of 6,604 km / hr. That’s more than one Earth diameter every two hours! Put another way, it means at this latitude my spot would complete one full circuit in 26.5 days.
So, how did we do? How does our estimated speed compare with the actual value? ESA has a handy graph here (scroll to the very end of the document, page 6). From this graph we can extract the angular speed in degrees for any solar latitude. For my latitude of 16 degrees, I find an angular speed of roughly 14.37 degrees per 24 hours. Using the same formula immediately above, but swapping out the angle value of 12 degrees for 14.37, and 21.21 hours for 24, gives me a real-Universe speed of approximately 6,989 km/hr. In other words, a difference of just under 6%. Considering the simple tools, pretty darned good!
And that’s about it! I hope you enjoy trying your own measurement as much as I did, and would love to hear the value you get, how it compares to the true value, if you have ideas for how to improve this process, and about any experiences you had along the way. Comment below or mail me at patrick@whatimlookingat.com.
But wait, there’s more!
Oh hold up, we’re not actually 100% done! I mentioned at the top of the previous section there are at least a “couple” of wrinkles with my plan, but then only explained one of them, right? Ok, here’s the other one. According to the Stanford Solar Center: “The Earth doesn't orbit exactly around the Sun's equator, so through the year the center of the solar pictures moves up and down a little more than 7 degrees. This angle varies sinusoidally through the year and is called B0. Earth crosses the Sun's equator about December 7 and June 7 each year.” This means that for much of the year we’re not actually looking at the Sun with its equator perfectly in the middle. For the purpose of our rough calculations, I figured this minor difference matters little. But if you to be more precise, you can instead download the adjusted grid for your current month from the Stanford Solar Center. Just be sure when you orient your north pole using one of these grids, your sunspots are definitely traveling from west to east (left to right). Enjoy!
Bonus points
NASA has been all in on the Sun this year, owing to the arrival of the latest Solar Maximum, plus exciting missions currently under way. Check it out at Heliophysics Big Year.
There’s an amazing wealth of real-time and near real-time data now online from a variety of probes and observatories. Two great choices to explore are Helioviewer and SpaceWeatherLive.
Did you know?
Galileo was an avid student of the Sun, and among other things left behind a series of incredible hand drawings depicting sunspots.
Although individual sunspots tend to remain near the same latitude as they spin around the Sun’s axis, the latitudes where spots are most commonly observed shift as each solar cycle progresses, in a pattern resembling a butterfly’s wings.
As the only star we can study up close the Sun is the focus of intense scientific scrutiny from many Earth-based observatories – now including your smart telescope! – but also probes like SOHO and the ESA Solar Orbiter. On December 24, the Parker Solar Probe – the first spacecraft in history to touch the Sun’s corona – will make its closest approach, spiraling to within just 3.9 million miles (6.2m km) of the Sun’s surface. To put that in perspective, that’s only 4.5 solar diameters away. Spicy!


